Best Fishing App for Analysis – Catch Statistics & Patterns
This is where your data becomes real knowledge. The fishing app analysis in AngelStratege lets you evaluate catches from your own fishing data – and shows you patterns and correlations that you wouldn't recognize with the naked eye.
Your catches are linked with the weather conditions of each session. This helps you recognize catch patterns at which air pressure, wind or weather trend you are most successful at your fishing spots.
AngelStratege offers two evaluation areas:
1. Activity (Catches / Bites)
The activity evaluation shows you when and how successful you were at the water. Four charts give you different perspectives:
Activity Rate
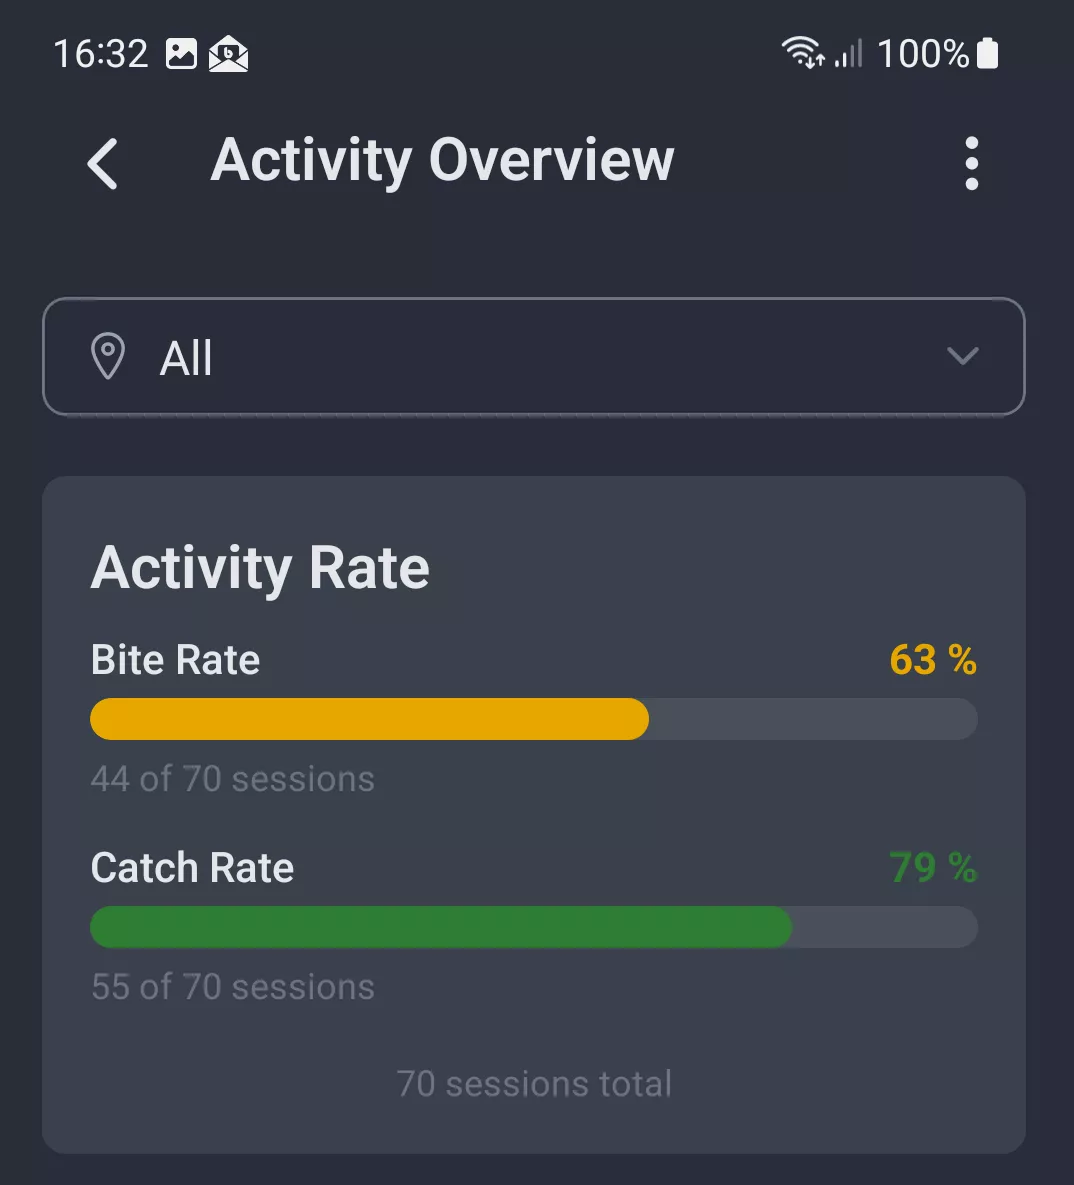
The activity rate gives you a quick overview of your fishing success. Using the spot filter you can narrow down the evaluation to a specific water or view all your sessions together.
The bite rate shows in how many of your sessions there was any activity at all. The catch rate makes visible in how many sessions you actually landed a fish.
Both metrics are displayed as:
- Percentage value
- Ratio to the total number of your sessions
This way you can see at a glance how active your fishing times really were - regardless of whether each session ended with a catch.
Note: Activity is defined as at least one bite or one catch within a session.
By Month
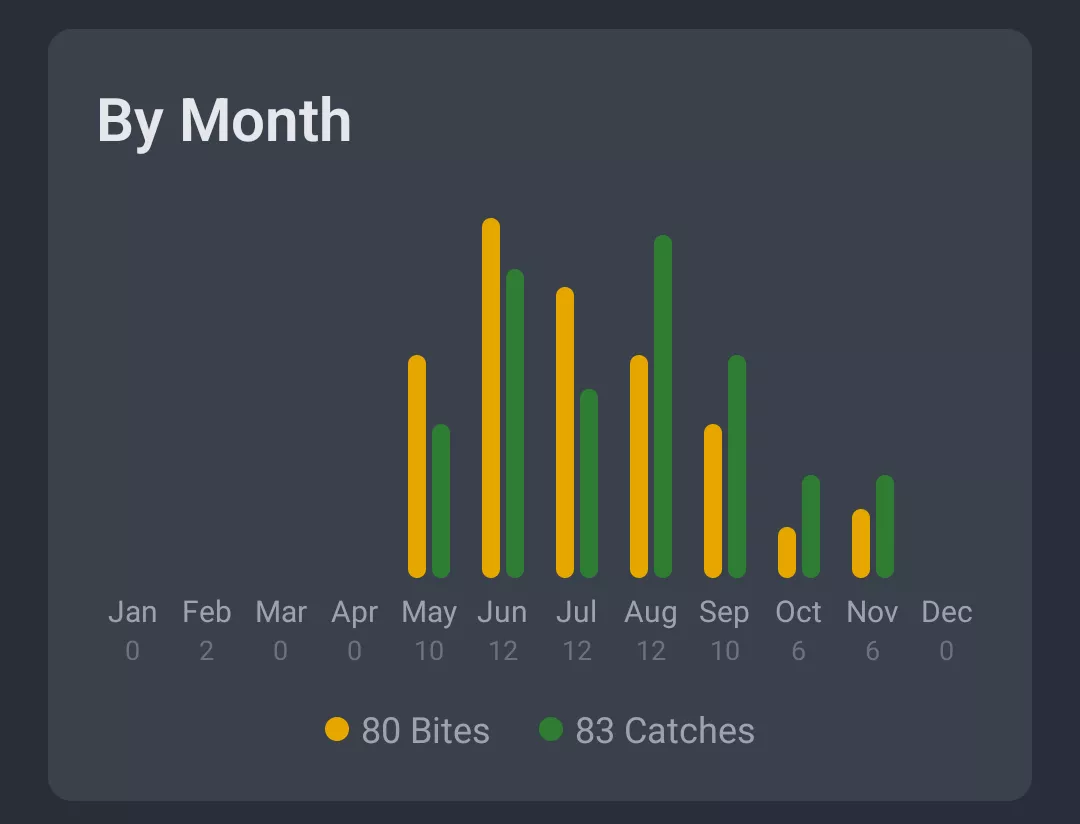
The monthly overview shows you in which months you had the most bites (orange) and catches (green). This makes seasonal patterns visible - such as particularly active summer months or successful autumn phases.
By Time of Day
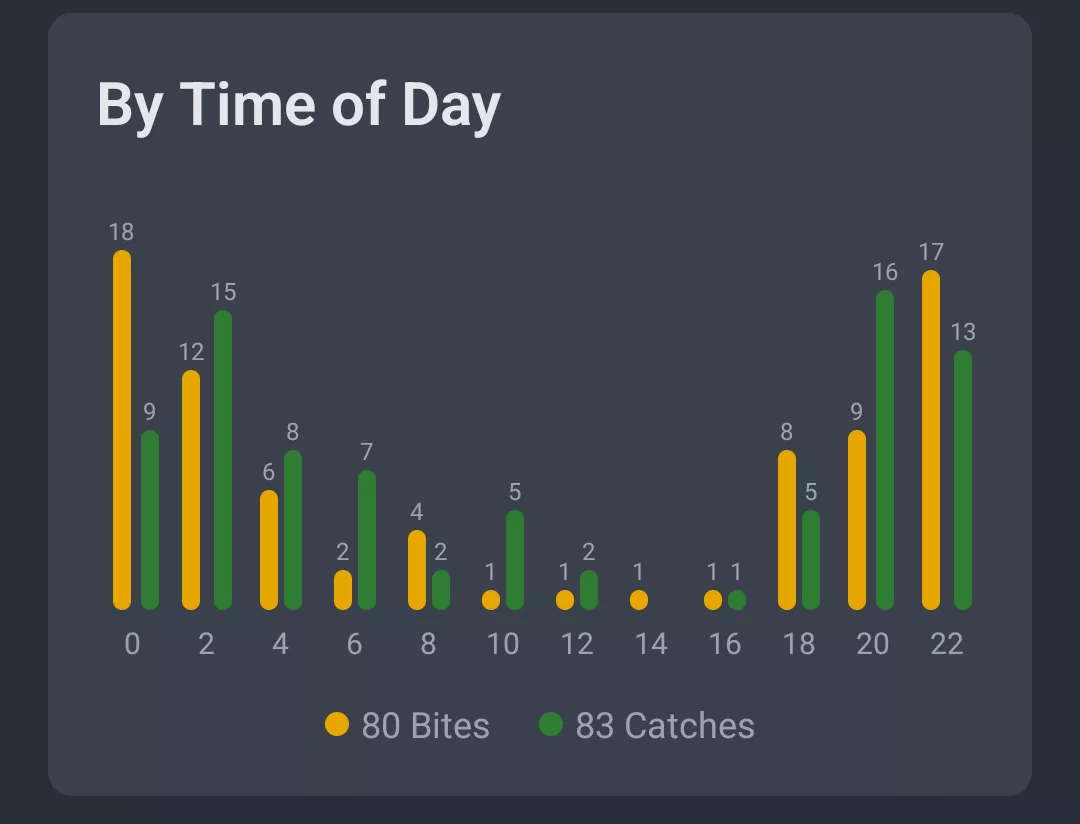
The evaluation by time of day breaks down your successes throughout the entire day. The hours from 0 to 24 show you at what times of day most activity occurs for you.
Whether early bird or night angler: Here you can clearly see when fishing has been most worthwhile for you.
By Moon Phase
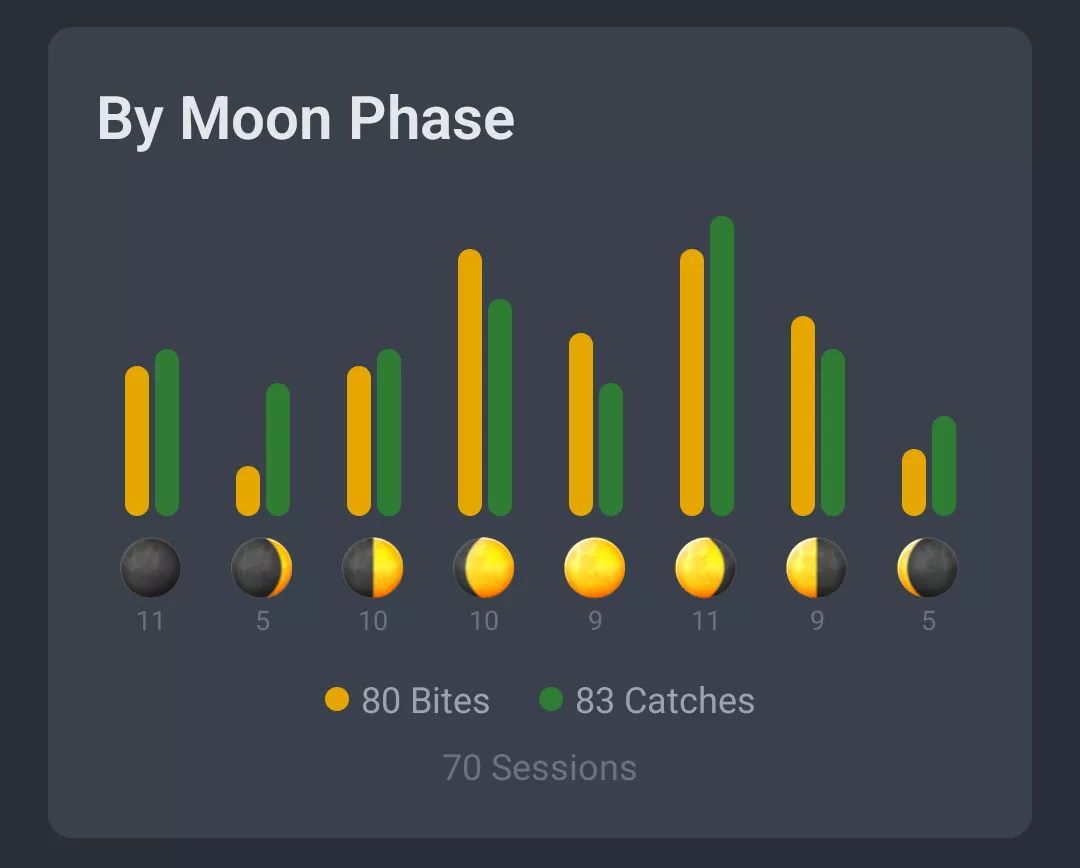
The moon phase overview shows you in which moon phases you recorded the most bites (orange) and catches (green). This allows you to identify possible correlations between activity and moon phase - as a supplementary classification alongside time, weather, and fishing spot.
2. Catches
With the catch overview you can see at a glance which fish you have caught most often. The spot filter at the top allows you to narrow down the evaluation to a specific water or view all your catches together.
This way you can compare which fish species were particularly successful for you at which spot.
Evaluation by Species Group
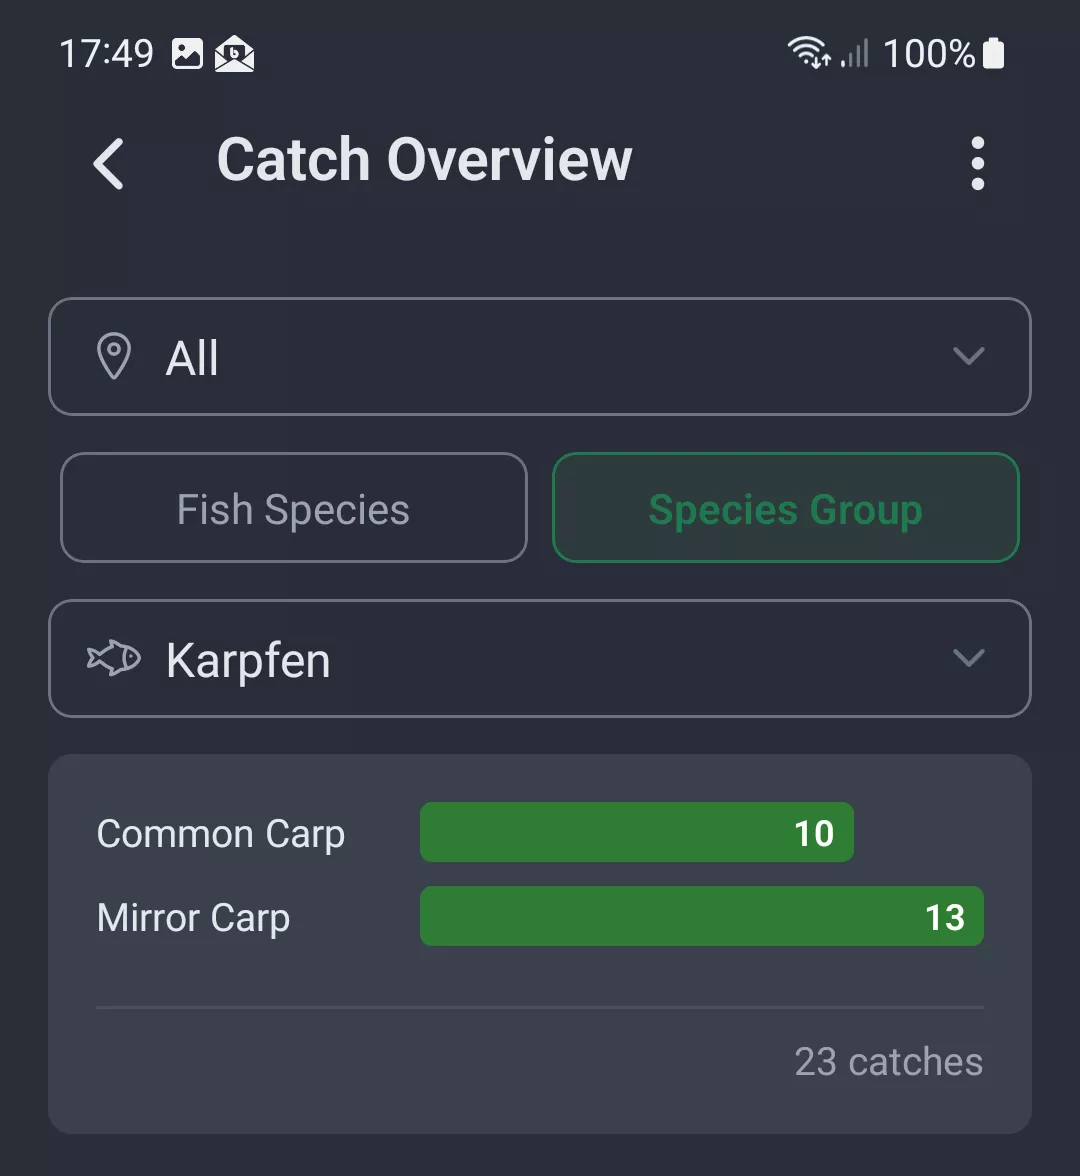
In the "Species Group" tab you can evaluate your self-created groups. For example, if you have created a group "Carp", all associated catches are displayed here - broken down by individual species such as Common Carp, Mirror Carp or Grass Carp.
This is ideal for analyzing your target fish specifically and making differences visible within a species group.
Tip: Create your own species groups, to summarize your favorite fish and evaluate them specifically.
Evaluation by Species
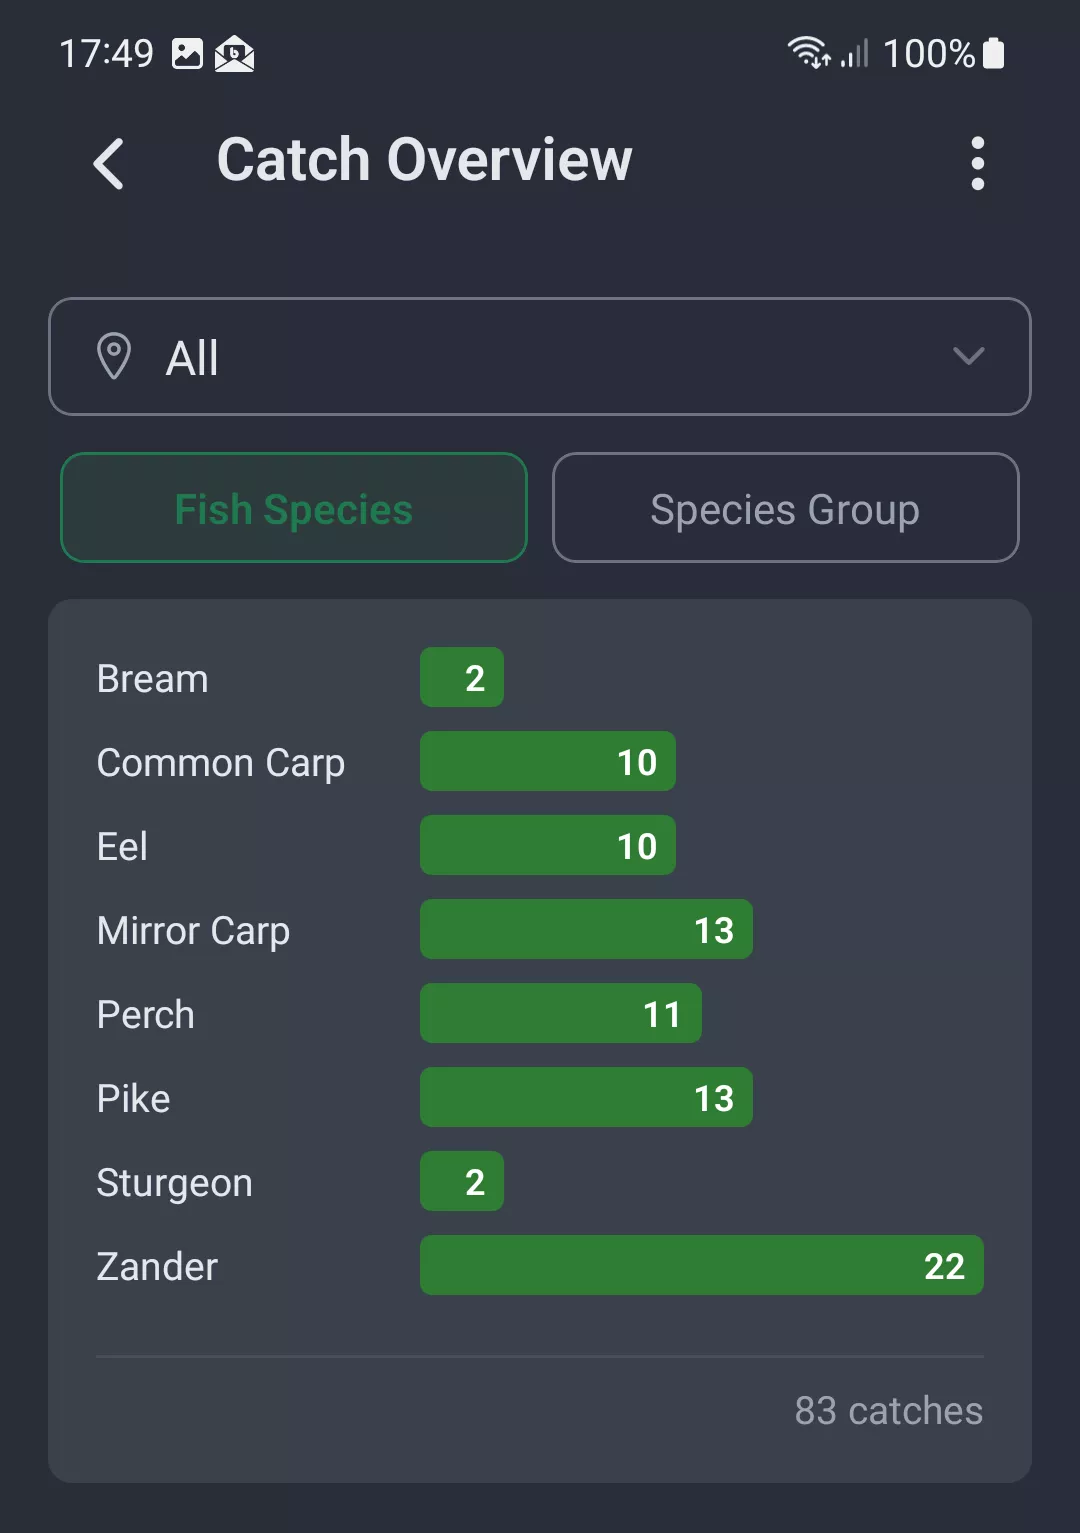
In the "Species" tab all your catches are broken down by species. The bar chart shows you how often you were able to land each fish species.
This allows you to immediately see whether you catch Zander, Perch or other species more often - and which fish define your fishing success.
The total number of your catches is displayed at the bottom of the chart.
3. Territory Map
The territory map shows you at a glance where you have fished in your territory. Use the spot list to switch between your spots and select the desired one.
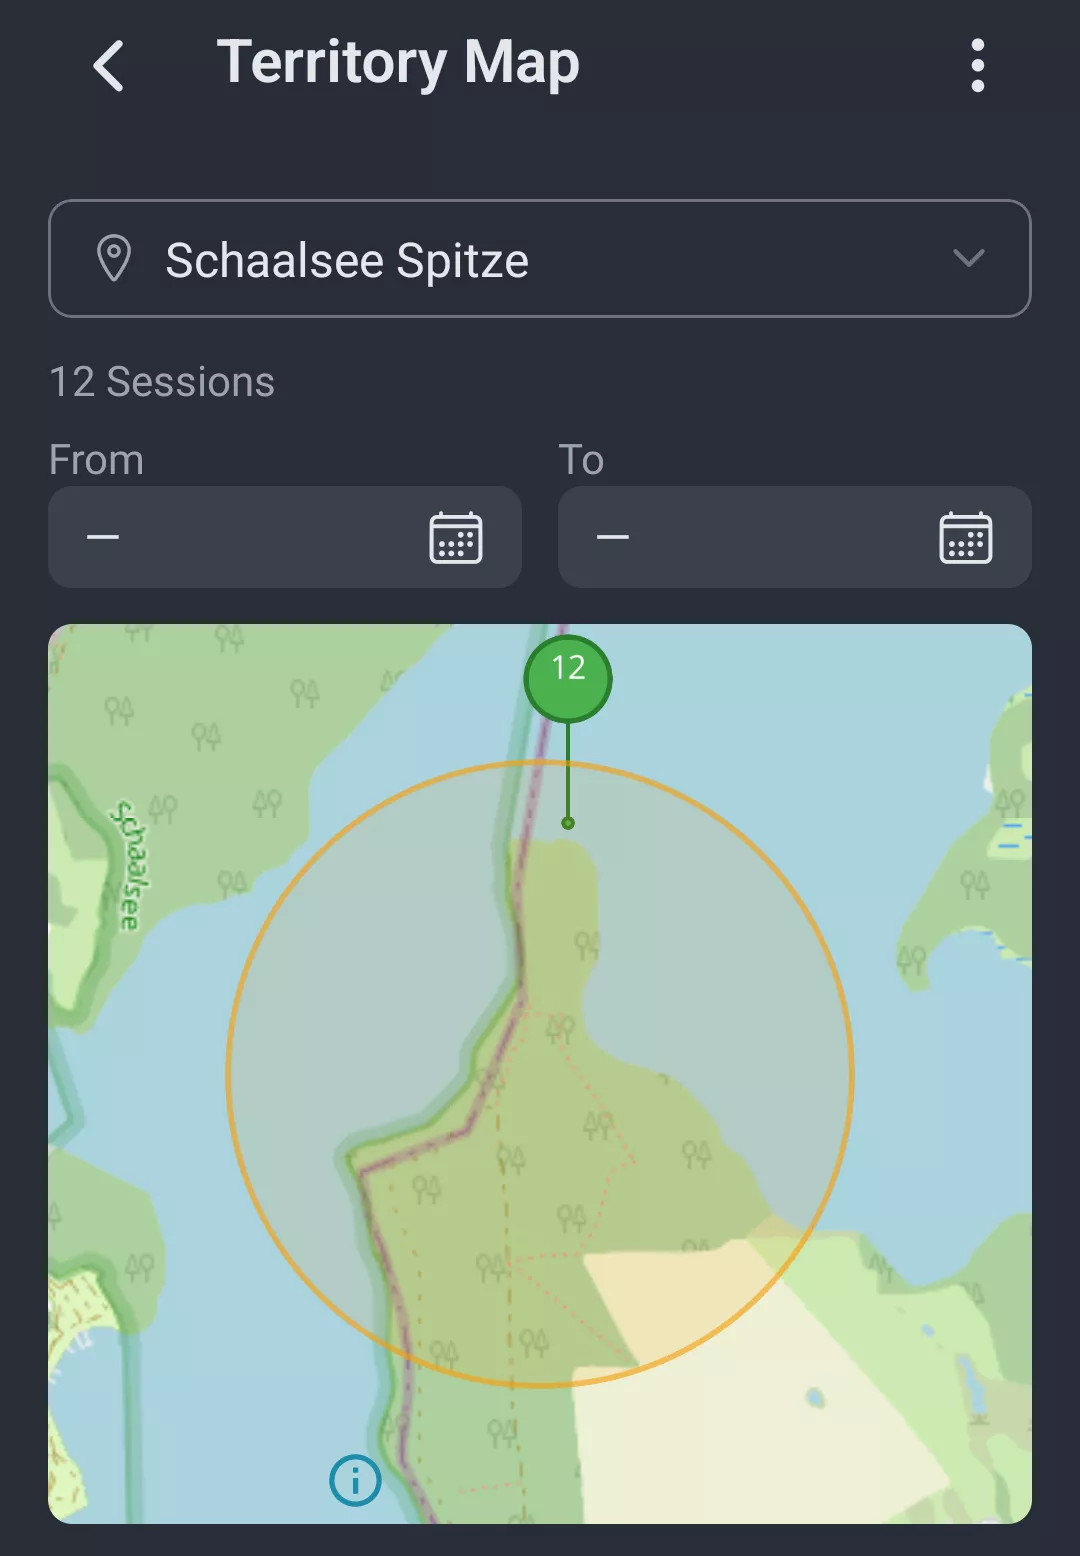
Each of your sessions is displayed as a marker on the map. If you have conducted multiple sessions at the same location, the marker shows the number of sessions.
The territory map serves two purposes:
- Verification: You can immediately see if your sessions are correctly assigned to the spot.
- Overview: You can see which locations in the territory you have fished and how often.
This way you keep track of your fishing activities and can specifically explore new spots or revisit proven locations.
4. Territory Comparison
The territory comparison shows you all your territories at a glance and makes differences in your activity visible.
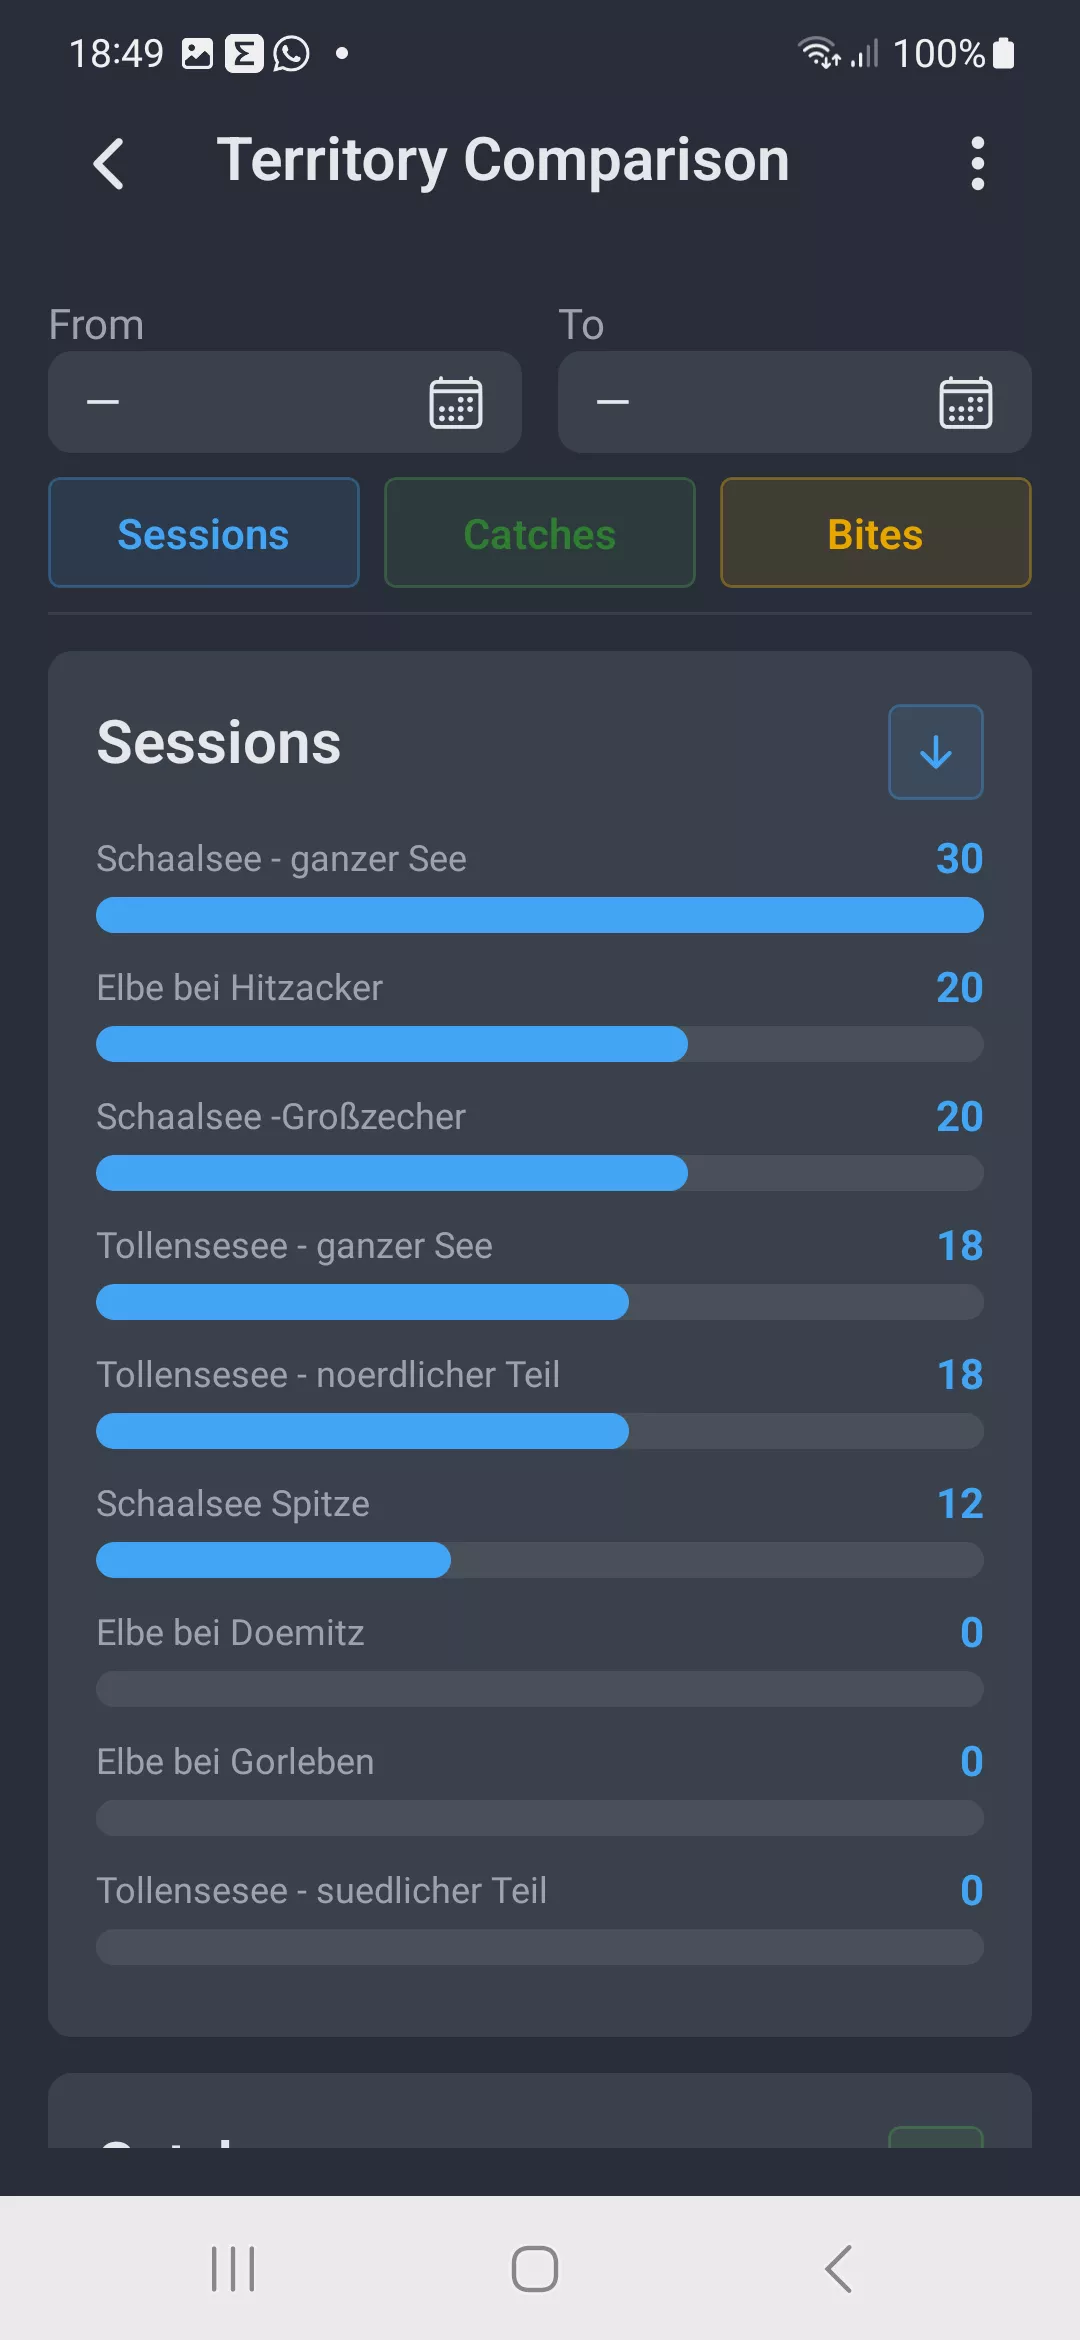
Using the time filter (From / To) you can limit the evaluation to a specific period – such as the current season or the last year.
Three areas are available:
- Sessions: How often were you in each territory?
- Catches: Where did you catch the most fish?
- Bites: In which territory was there the most activity?
Each area can also be sorted – by name, sessions, catches or bites. This way you can quickly see which territories are most productive for you.
5. Weather Analysis
Every angler feels that weather plays a role. But is that really true? The weather analysis gives you an answer – based on your own data.
The app automatically records the current weather conditions for each session. In the weather analysis, this data is evaluated and displayed as clear bar charts. For each weather category, you can see how many bites (orange) and catches (green) you had on average per session.
Air Pressure
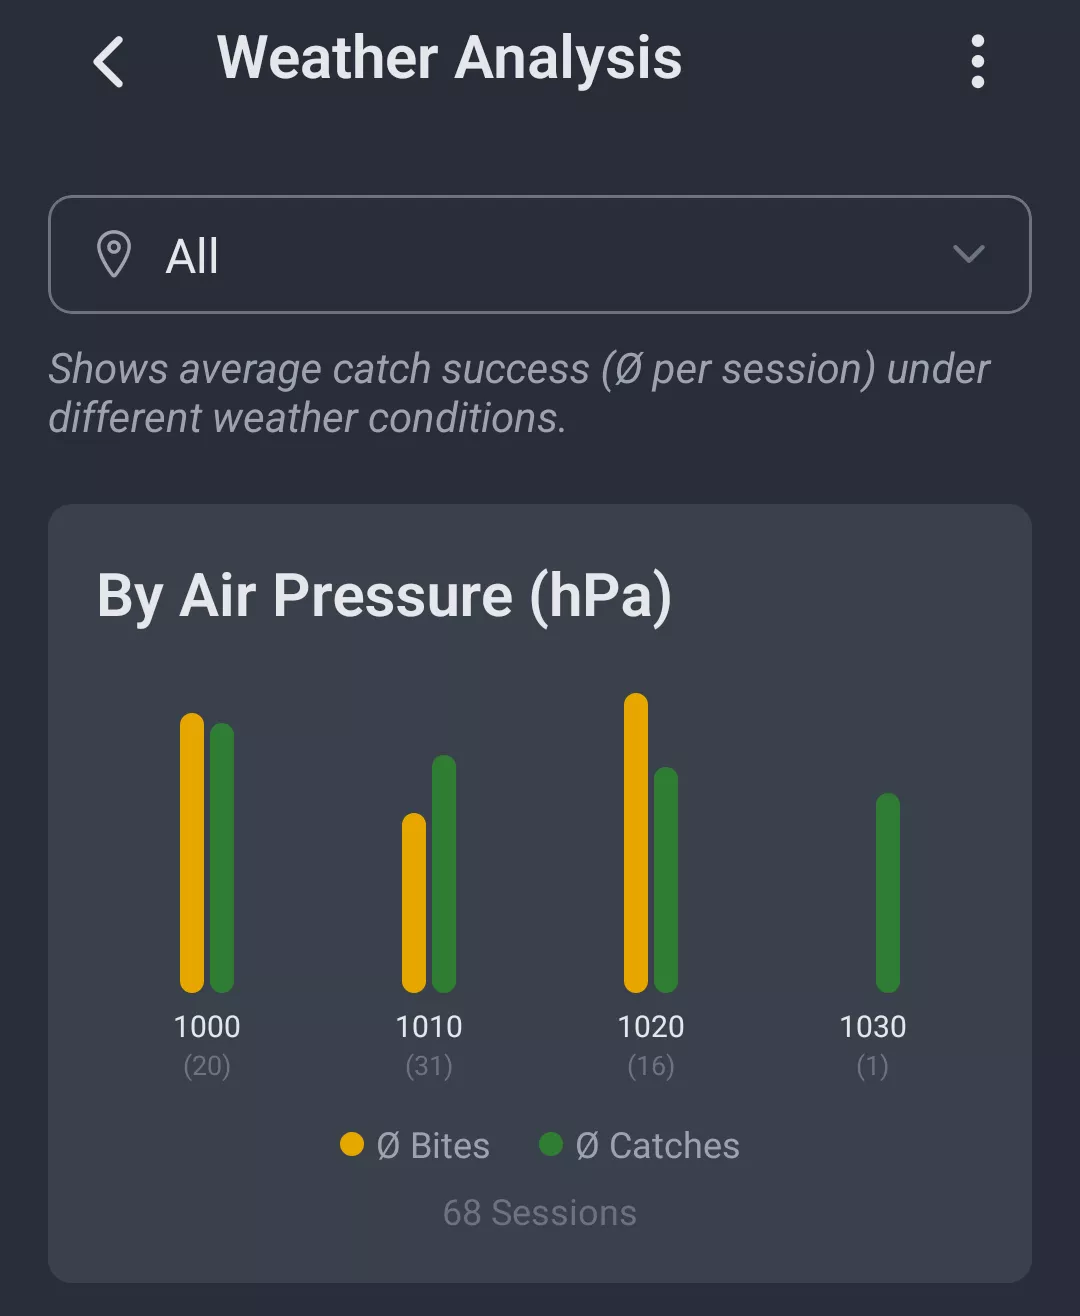
Air pressure is grouped in 10 hPa steps. The ranges are dynamically determined from your existing data – so you only see relevant values for your region.
Wind Strength
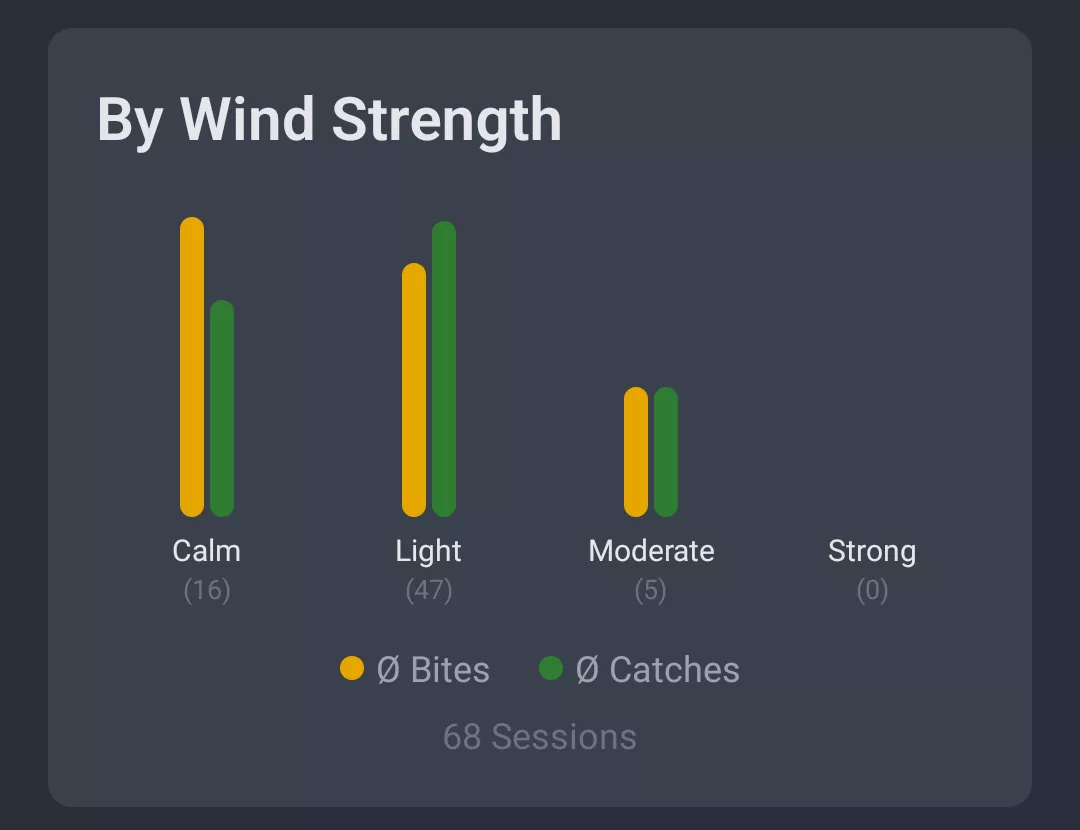
Wind strength is divided into four categories: Calm, Light, Moderate and Strong. This way you can see at a glance in which wind conditions you are most successful.
Wind Direction
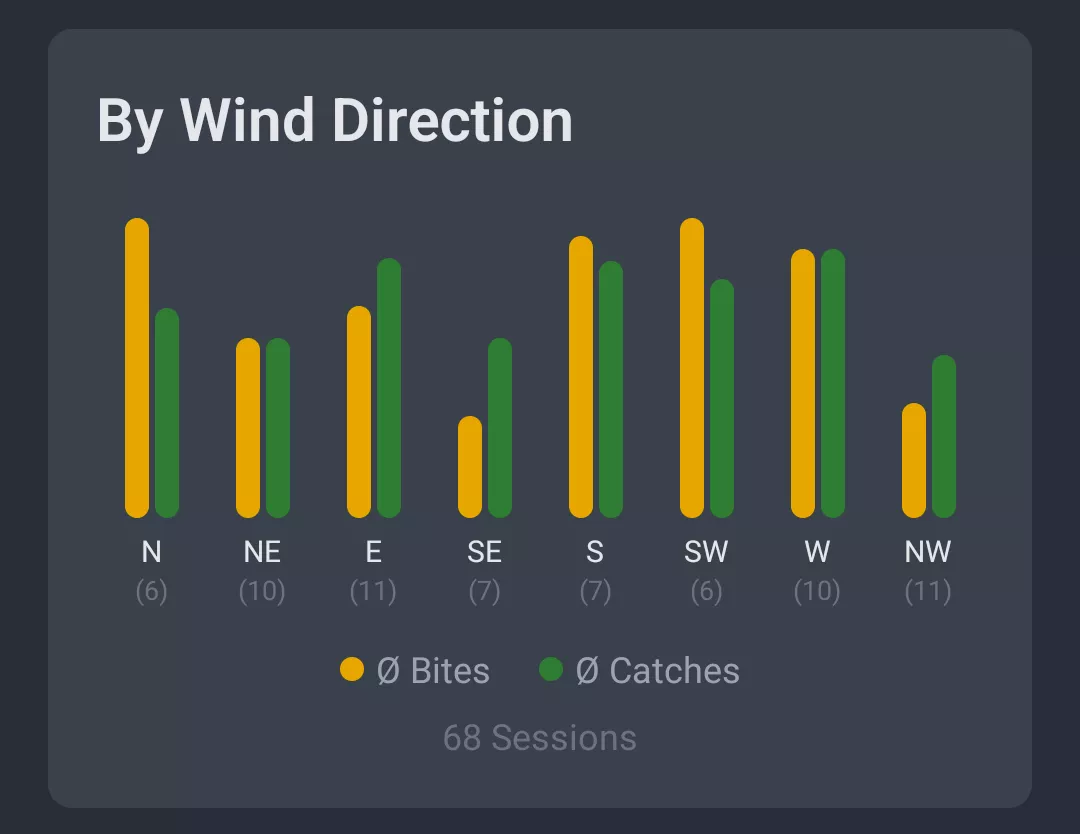
Which wind direction brings you the most catches? The bar chart shows the number of your bites (orange) and catches (green) broken down by the eight wind directions: N, NE, E, SE, S, SW, W and NW.
This way you can identify whether certain wind directions at your waters regularly lead to better results – an important factor, as wind affects currents, food supply and water temperature differently depending on the water.
Cloud Cover
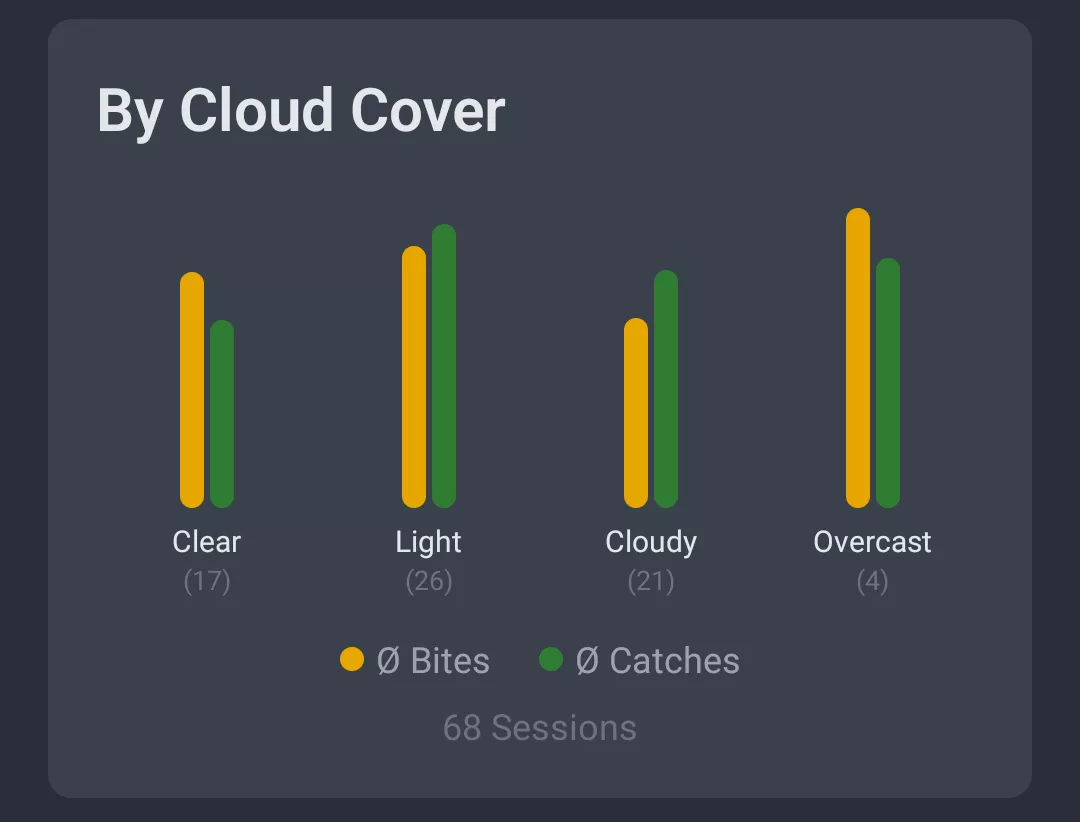
Cloud cover is divided into four categories: Clear, Light, Cloudy and Overcast. Find out whether you catch better in sunshine or under clouds.
Note: The weather analysis shows average values per session. This makes the comparison fair – regardless of how often you fished under certain weather conditions.
Analysis on Multiple Levels – Recognize Catch Patterns
AngelStratege offers you evaluations on several levels, so you can analyze your fishing success from different perspectives. Here is an overview of the analysis options:
Evaluate Catches and Bites
How often do you have bites? How many sessions end with a catch? The activity rate gives you an honest picture of your fishing success – broken down by spot and time period.
Evaluation by Fish Species and Groups
Which fish species do you catch most often? How successful are you with specific fish groups such as predators or carp? The species-based evaluation helps you understand your strengths.
Fishing Success per Spot
Compare your fishing spots with each other: Where do you catch the most? Where is the activity highest? The territory comparison makes differences in fishing success visible across your waters.
Weather Trends and Air Pressure Analysis
At what air pressure do you catch best? Which wind conditions are favorable at your waters? The weather analysis links your catches with weather data and reveals the conditions that lead to success for you.
Moon Phase Fishing Analysis
Do you catch more during certain moon phases? The moon phase fishing analysis shows possible correlations between lunar cycles and your activity – as a supplementary perspective alongside weather and time of day.
Your Data, Your Knowledge
All evaluations are based exclusively on your own data. You don't see any general statistics, but personal insights from your own fishing experiences at your waters. This makes the catch statistics in AngelStratege fundamentally different from generic fishing statistics: every chart, every number reflects your reality – at your spots, with your methods, under your conditions.
The more data, the better the evaluations. After just a few sessions, the insights are still limited. But with a growing database, the patterns become clearer and the evaluations more valuable.